
ParaDigMA
Conventional Sediment Echosounding
In the 1980's, sediment echosounder data were still recorded on (thermal) paper, producing black and white plots, and interpretation was difficult and tedious, since paper recordings did not allow easy adjustment of image quality to the sediment properties and water depth. The dynamics of these images was very low. While the 'Precision Depth Recorder' (PDR) with a frequency of 12 kHz was targeting the water depth measurement, the 3.5 kHz system introduced in the 1970's were imaging sediment strata in a much higher quality, but still using only black and white for amplitude display.
 Parametric Sediment Echosounder Parasound
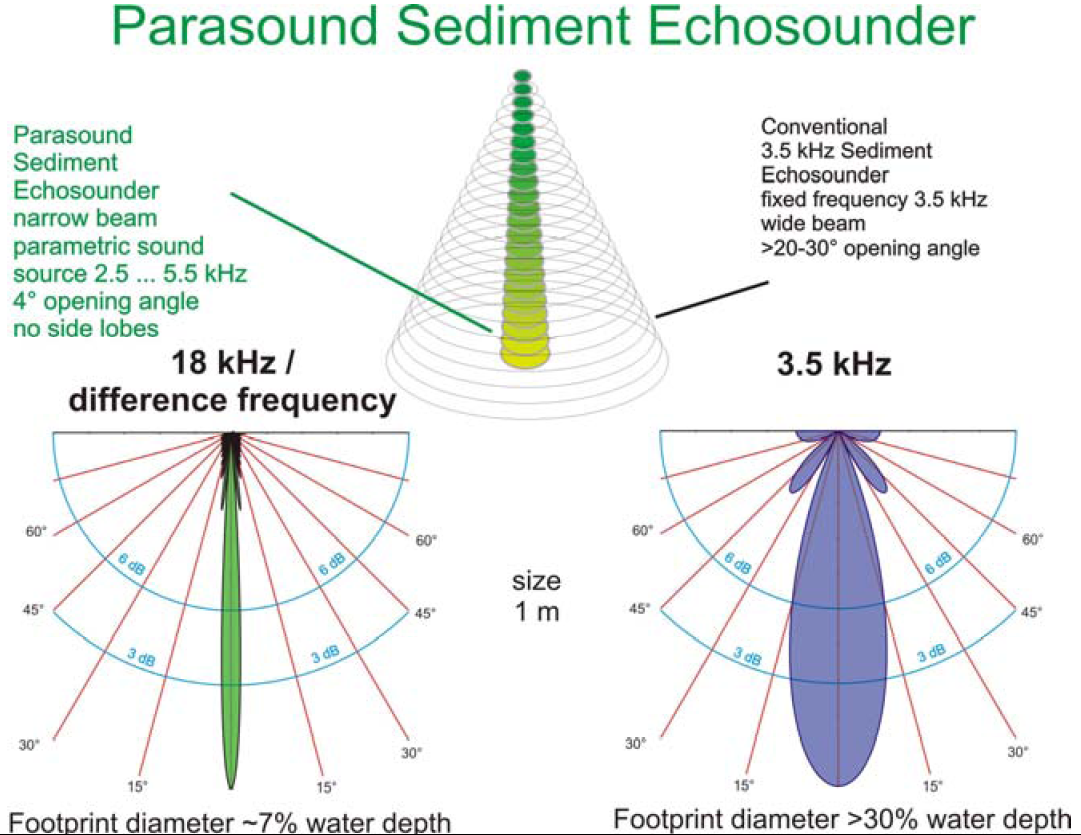
In 1986, a new technology was introduced, where the 'parametric effect' was utilized to focus the energy of the emitted sound beam into a very narrow cone of only 4° for a 4 kHz frequency, which is technically impossible with conventional transducer technology. It requires, however, to operate the sounder close to the caviation limit above 220 dB. The Parasound (PS) system was first installed by Atlas Elektronik GmbH on the research vessel Meteor und a paper recorder (DESO) and low resolution analog color displays (Colorscope).
Parasound Digitization and Multifrequency Analysis Tool ParaDigMa
In 1989, technical capabilities were available on the market for lab instrumentation together with the new class of personal computers, which could be connected to design an affordable and fast data acqusition system for acoustic data. It was mobile and could be attached to the analog output of Parasound signals (4 secondary and 18 kHz primary frequency) to digitize them at very high sample rate of up to 100 kHz. Based on an HP3820 realtime data acquisition unit with an own operating system, data were transferred via HP-IB to the PCs and could be stored on various media such as cartridge tape, 8-tracks tapes or lateron on hard disks.
The ParaDigMA software package for realtime recording, storage and analysis was written by Volkhard Spiess between 1989 and 1992, being installed for routine operation on all German research vessels Meteor, Sonne and Polarstern.
Digital Parasound Data for Interpretion and Core-Seismic Correlation
The access to digital data provides many advantages such as scaling of distance and vertical axes, adjustment of amplitude gain for resolution or penetration optimization.
Beyond this, a numerical comparison with physical property measured on sediment cores could be carried out to better understand the nature of reflections and interpret amplitudes with respect to density or velocity changes.
Rostek et al. (1981) published a first comparison of core logs with PS seismograms, confirmaing that this approach can provide new insights into depositional settings and high-resolution acoustic stratigraphy.
References
Spiess, Volkhard (1993) Digitale Sedimentechographie - Neue Wege zu einer hochauflösenden Akustostratigraphie.
Berichte, Fachbereich Geowissenschaften, Universität Bremen, 19,
https://media.suub.uni-bremen.de/bitstream/elib/3727/1/00010173.pdf.
Rostek, Frauke, Spiess V., Bleil U. (1991) Parasound Echosounding – Comparison of Analog and digital Echosounder Records and Physical Properties of Sediments from the Equatorial South Atlantic. Marine Geology, 99, 1-18, https://doi.org/10.1016/0025-3227(91)90079-J.
Original manufacturer: Atlas Elektronik GmbH, later Atlas Hydrographics GmbH, now sold as Parasound Echosounder by Teledyne Reson
Early echosounder black&white recordings of a precision depth recorder (PDR; Luskin et al., 1954)
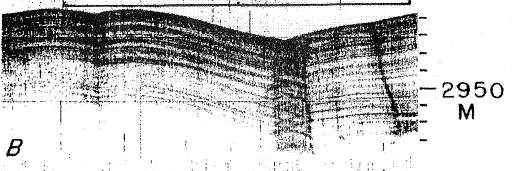
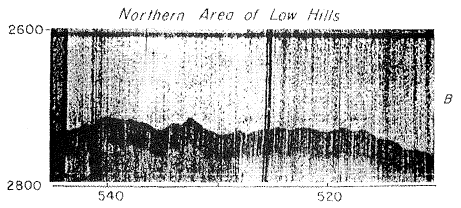
3.5 kHz analog recording penetrating >50 m and imaging clearly stratification. Topography is partially masked due to wide emission beam (Flood, 1980).
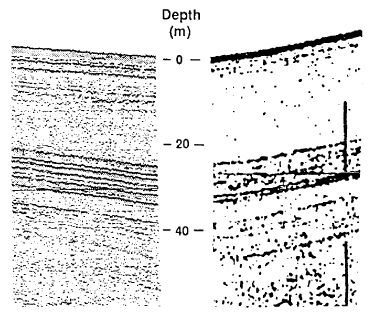
Comparison of Parasound (left) and 3.5 kHz (right) analog recordings along the same profile. Reflectors are sharper and dynamics is higher for PS data (Spiess, 1993)
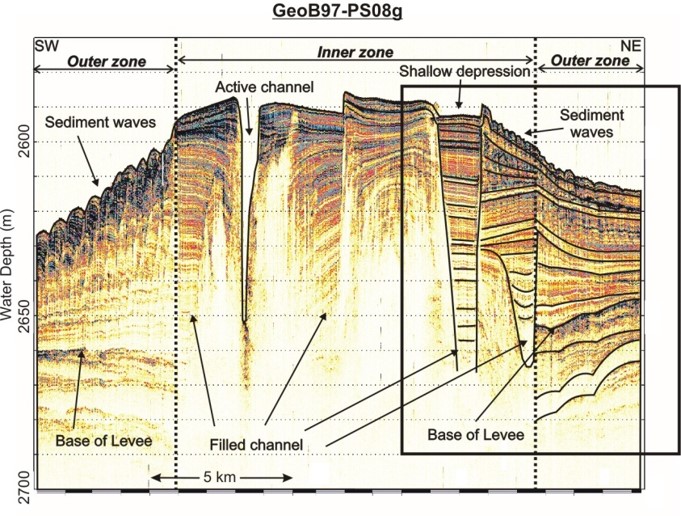
Digital Parasound Profile processed and scaled after recording to optimize image quality (Schwenk et al., 19xx)