Imaging
While we are dealing with huge volumes of digital data in the first place, at the end we have to work up the data in a way, that the human eye and our imagination can learn about geologic structures and features on our Earth. It's all about contrasts in the subsurface, which will, when hit by a sound wave, reflect or scatter energy back to a recording system. Whenever density and velocity change, such 'impedance' contrasts will show up as seismic reflectors (or horizons) in a seismic section.
If the origin of the impedance change is known, tracing horizons can be used as stratigraphic marker, to determine ages and help to understand environmental changes.
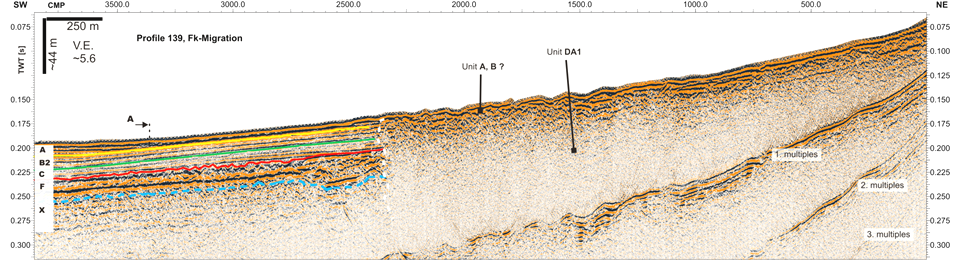
 Displaying the seismic amplitude is the most straightforward way to generate a seismic image. Typically, color scales are used which enhance contrasts and suppress noise in 'variable density' plots. The classical way was to display the seismograms in back and white or red/blue 'wiggle trace and variable area' plot, but amplitudes cannot easily displayed for longer profiles compared to color scales..
Beyond the simple control of gain and contrast, seismic data are often mathematically transformed into socalled 'seismic attributes' to further enhance particular features, such as instantaneous phase, frequency, envelope, coherency, sweetness etc., which are widely used in hydrocarbon exploration.
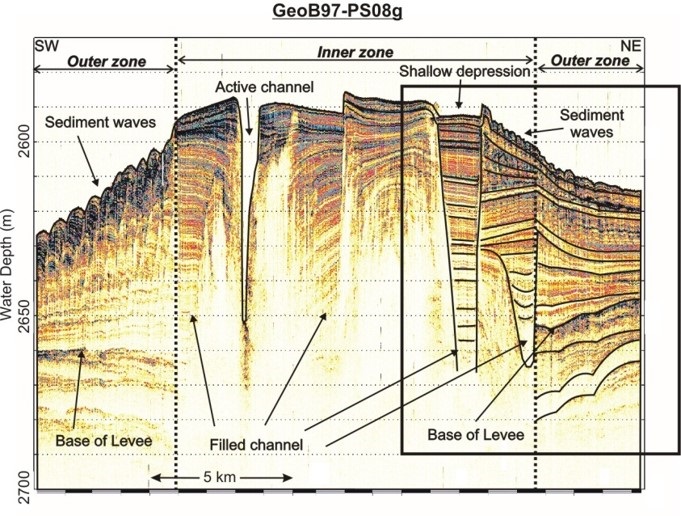
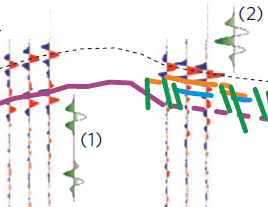
1: channel-levee system (Schwenk et al., 2003),
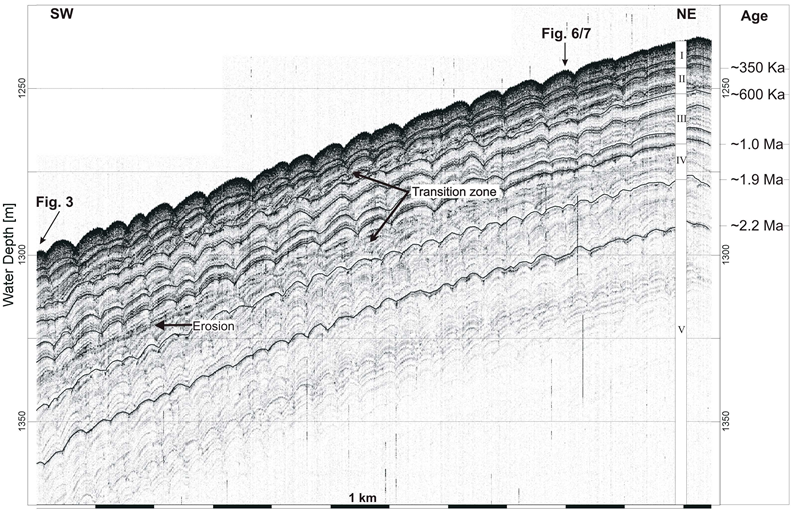
2: small-scale mudwaves (Keil, 2001)
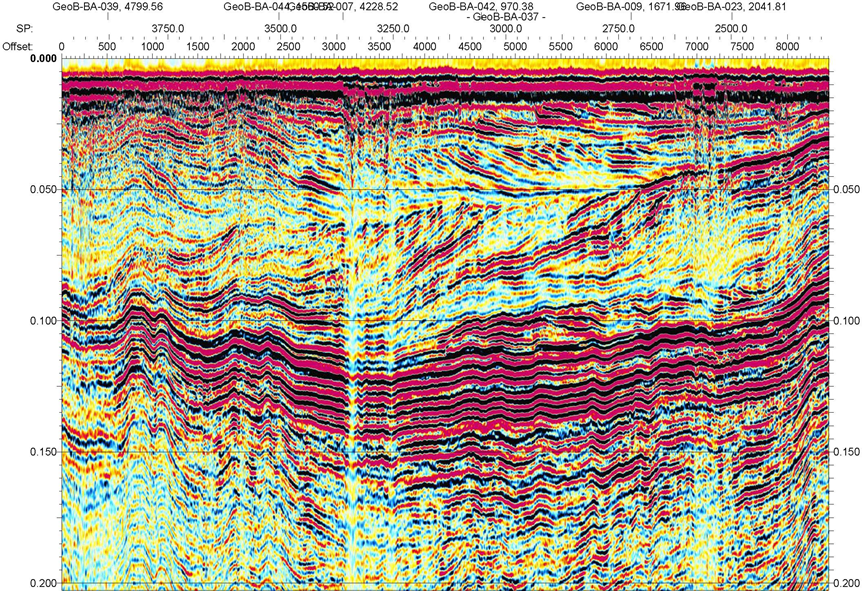
3: Balaton Miocene sequences (Visnovitz et al., 2015),
4: glacial deformation/bedrock Baltic Sea,
5: pyroclastic flow off Herculaneum,
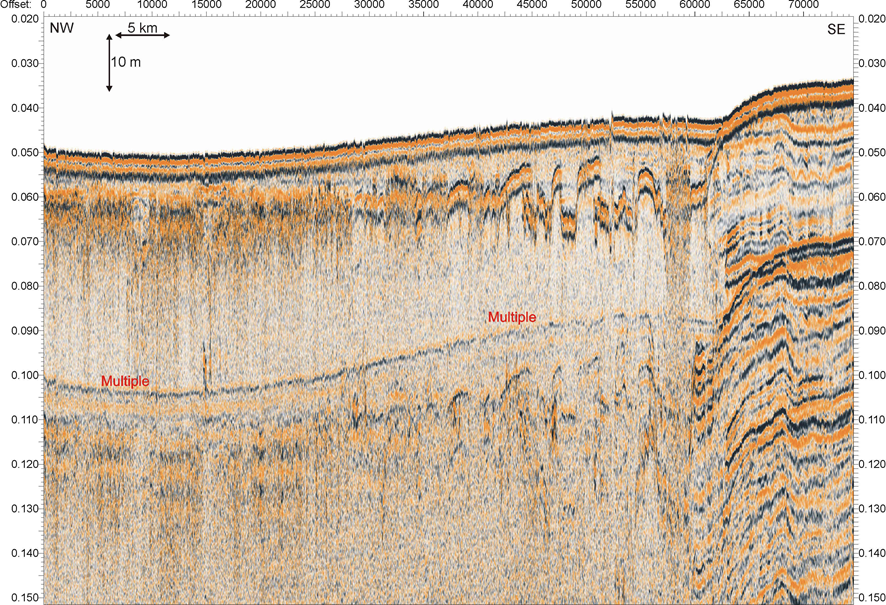
6: current-initiated pockmarks (Wenau & Spiess, 2021),
7: submarine permafrost (Rekant et al., 2015),
8: subglacial tunnel valley Anholt,
9: deep water coral field,